Ecommerce Email Marketing Statistics: 7 Benchmarks to Know
The most useful ecommerce email marketing statistics come from online stores, carry a recent date, and say exactly how each rate was measured. Across the sources below, a healthy store sees open rates around 30%, click rates between roughly 1.7% and 5%, and conversion rates that swing widely depending on whether you count per click or per recipient. If you are grading a campaign, start with items 1 to 3. If you need to defend your email budget, go to items 4, 5 and 7. If you are deciding how often to send, read item 6.
The trouble is that the numbers scatter. One report says the average open rate is 20%, another says 36.5%, and a third says 29.81% for ecommerce. The gaps come from different data sets, different definitions, and Apple's Mail Privacy Protection, which inflates opens. Without that context, you can fail or flatter your own program by accident.
This guide sets the figures side by side, names where each one comes from, and works examples so you can see what a rate means in orders. We are Chromex, an email and SMS agency for ecommerce brands founded in 2021. Most figures date from 2023 to 2026, and I flag the date wherever it matters.
1. Open rates for ecommerce emails
What the data says
Ecommerce brands average an open rate near 30%, while all-industry averages run higher, between 33% and 36.5%. Mailchimp's data, last updated in December 2023, puts ecommerce at 29.81% against an all-user average of 35.63%. Open rates are inflated by Apple's Mail Privacy Protection, which Mailchimp itself flags as a caveat when reading its numbers.
| Source | Who it covers | Average open rate |
|---|---|---|
| Mailchimp (Dec 2023) | Ecommerce senders | 29.81% |
| Mailchimp (Dec 2023) | All industries | 35.63% |
| Shopify (2025) | Weekly senders | 33.22% |
| Forbes Advisor roundup | All email campaigns | 36.5% |
An open rate near 30% is a fair ecommerce baseline, but treat it as a direction, not a verdict.
How to use it
Treat 30% as a rough baseline, not a target. If your rate sits far below it, check deliverability before you rewrite a single subject line. Sender authentication, spam complaints and inbox placement explain more weak open rates than copy does.
Because privacy features distort opens, judge changes by clicks and revenue instead. That is why the Analyze step at Chromex opens with a full email audit and deliverability fixes in days 1 to 5.
2. Click rates for ecommerce emails
What the data says
Ecommerce click rates range from 1.74% to about 5%, and the spread comes mostly from who measured and on what base. Mailchimp's ecommerce figure is the low end, while Shopify's 2025 data shows frequent senders clicking at 4.87% to 5.31%.
- Mailchimp (Dec 2023): 1.74% for ecommerce, 2.62% for all users.
- HubSpot (2025): 2.5% average email click-through rate across industries.
- Shopify (2025): 4.87% for weekly senders, and 5.31% for twice-weekly senders, the highest in its data.
Use 1.74% as a floor and about 2.5% as a solid middle, and read the 5% figures as a stretch goal.
How to use it
Convert the rate into people so it means something. Say you deliver a campaign to 40,000 inboxes. At 1.74% you earn about 696 clicks. At 3%, you earn 1,200. That 504-click gap is the real prize, and it is bigger than any open-rate swing.
Click rate responds to the offer and the layout more than anything else. Keep one primary call to action, make it obvious on a phone, and send traffic to a landing page that matches the email. A mismatch there wastes the click you just earned.
3. Conversion rates from email
What the data says
Email conversion rates look wildly different depending on the denominator. Counted per visit from email, they land near 2% to 3%. Counted per recipient, they fall to a fraction of a percent. Neither is wrong, but they answer different questions.
| Source | What it measures | Rate |
|---|---|---|
| Statista (2025) | All ecommerce site visits | Under 2% |
| Statista (2025) | Skincare vs. luxury apparel sites | 2.7% vs. 0.4% |
| FirstPageSage (2025) | Email-driven conversions, B2C | 2.8% |
| MailerLite | Campaign recipients | 0.32% (about 3 sales per 1,000) |
Email visitors convert better than the average shopper, but only about 3 in 1,000 campaign recipients buy.
How to use it
Pick one definition and stay with it. Revenue per recipient works well because it combines open, click and conversion into one number. Take a 10,000-recipient campaign at 0.32%. That yields about 32 orders, and at a $60 average order value, $1,920, or roughly $0.19 per recipient.
Once you have that baseline, test one element at a time: the offer, the subject line, the send time or the layout. The Optimize stage at Chromex, from day 30 onward, runs mass testing across the whole email system for this reason, because small lifts compound across every send.
4. Automated emails versus campaigns
What the data says
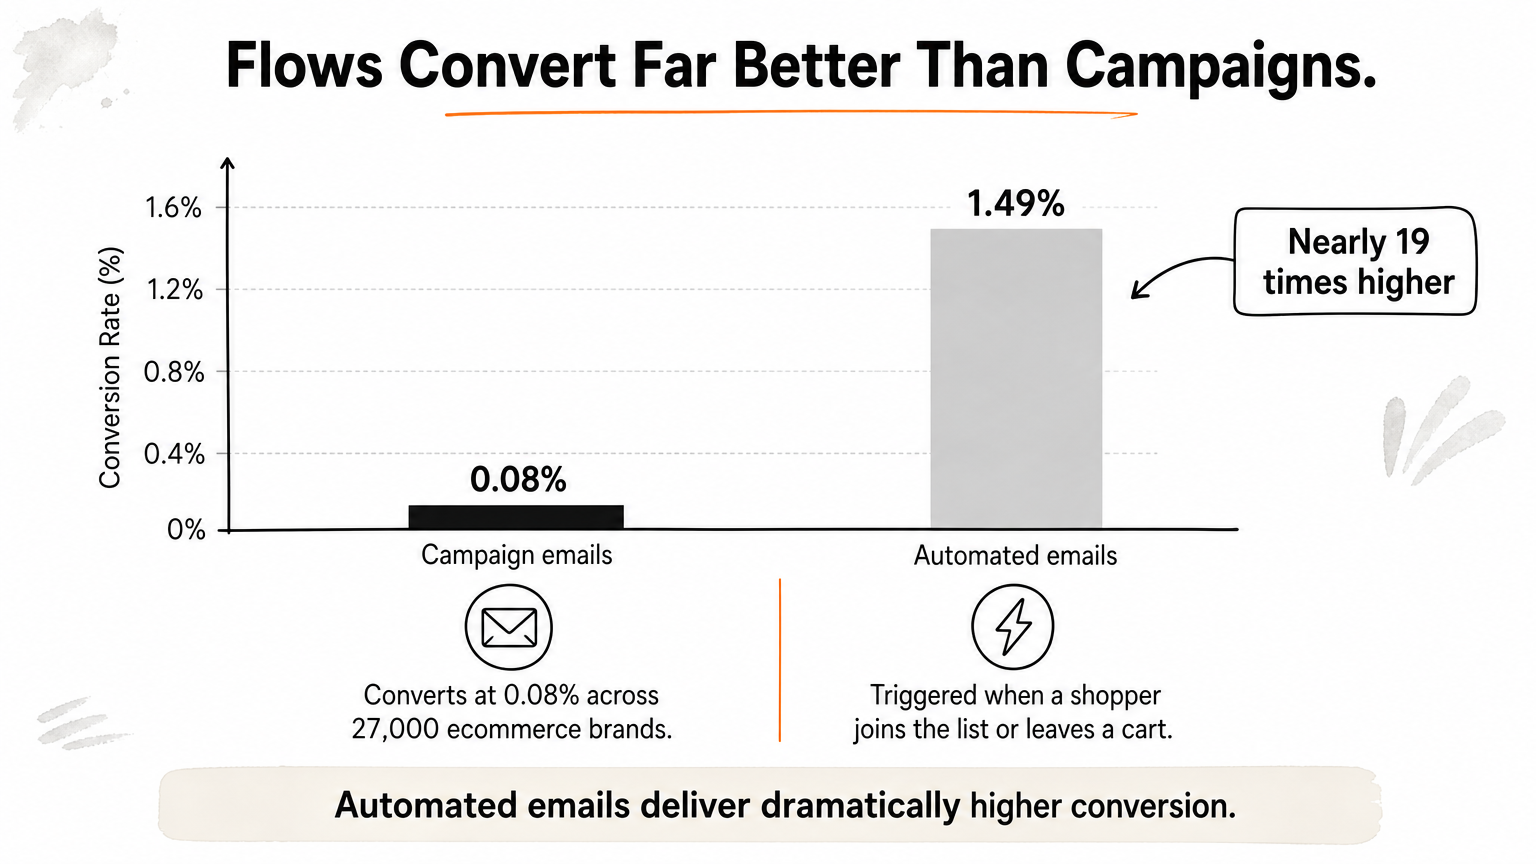
Automated emails convert far better than one-off campaigns. Across 27,000 ecommerce brands, Wix reports campaign emails converting at 0.08% and automated emails at 1.49%, nearly 19 times higher. The gap exists because a flow fires when the shopper shows intent, such as joining the list or leaving a cart.
- Welcome emails: reported open rates run from 69% to about 84% across two sources, and one source reports a 27% click rate.
- Triggered and targeted email: the Data & Marketing Association figure, cited by Campaign Monitor, says 77% of email ROI comes from segmented, targeted and triggered campaigns.
A flow earns its keep because it reaches people at the moment they are ready to buy.
How to use it
Put the numbers to work per 10,000 sends: a campaign at 0.08% brings about 8 conversions, and a flow at 1.49% brings about 149. Build flows before you add campaigns. A typical starting set is welcome, abandoned cart, browse abandonment, post-purchase and winback.
Chromex builds eight core automated sequences and a high-converting sign-up form in days 5 to 15 of an engagement. The form matters because every new subscriber enters the welcome flow, which gets the highest opens of any email you send.
5. Segmentation and personalization
What the data says
Segmented emails beat unsegmented ones on both opens and clicks. HubSpot's 2023 research found segmented sends drive 30% more opens and 50% more clickthroughs, and 78% of marketers called subscriber segmentation their most effective email strategy. Basic personalization is common but shallow, since 53% of marketers stop at putting a name in the copy.
- Opens: +30% relative lift for segmented emails.
- Clickthroughs: +50% relative lift.
- Marketers naming segmentation as most effective: 78%.
The data says segmentation outperforms a name merge tag, yet most brands stop at the name.
How to use it
Apply the lifts as relative changes, not additions. If your baseline is the 29.81% ecommerce open rate, a 30% lift gives about 38.8%. A 1.74% click rate with a 50% lift becomes about 2.6%. Treat those as a ceiling for planning, not a promise.
Start with three segments you can build today: new versus repeat buyers, engaged versus inactive subscribers, and product category interest. Keep each group broad enough to send to regularly. Segments that are too narrow cost more in creative time than they return.
6. Send frequency and unsubscribe rates
What the data says
More frequent sending did not hurt performance in Shopify's 2025 data. Weekly senders had a 33.22% open rate and 4.87% click rate, and twice-weekly senders reached the highest click rate at 5.31%. Unsubscribes stay low: Mailchimp shows 0.19% for ecommerce and 0.22% across all users.
| Cadence | Open rate | Click rate |
|---|---|---|
| Weekly (Shopify, 2025) | 33.22% | 4.87% |
| Twice weekly (Shopify, 2025) | Not reported here | 5.31% |
Weekly to twice-weekly sending is common among strong performers, and unsubscribes remain a fraction of a percent.
How to use it
Turn the unsubscribe benchmark into a count. With 50,000 subscribers and a 0.19% rate, each send costs about 95 subscribers. That is a normal price, and it only becomes a problem when your rate climbs after you raise the cadence.
Test frequency on your engaged segment first, not the whole list. HubSpot's survey of 2,057 adults found 86% wanted at least one promotional email a month, so some tolerance exists. Cut back for inactive subscribers instead of dropping the whole list's cadence.
7. Email ROI and revenue share
What the data says
Headline ROI claims run to about $42 to $44 returned per $1 spent. Campaign Monitor cites $44 per $1, and Emailchef cites 42 for every 1. Treat these as industry-wide averages, not promises for your store. In HubSpot's 2025 data, email was the top-ROI channel for B2C brands, but its 2026 report put email fifth among top-ROI channels at 22%, behind website, blog and SEO at 27%.
A Litmus survey also found about half of companies measure email ROI poorly or not at all, so many published averages rest on shaky tracking.
The $42 figure is real enough to justify email, but your own attributed revenue is the number that counts.
How to use it
Run your own math. Suppose you spend $3,000 a month on platform, design and management, and email-attributed revenue is $30,000. That is $10 back per $1, far below the headline but still excellent next to most paid channels.
Revenue share is a second health check. Chromex clients average 45% of monthly revenue from email, while many brands we meet sit under 10%. A big gap between your share and a mature program usually points to missing flows, not a weak channel.
Putting the numbers to work
The benchmarks hold together as one picture. Expect open rates near 30%, click rates between 1.7% and 5%, and conversion rates under 1% per recipient for campaigns. Flows beat broadcasts by a wide margin, segments lift opens and clicks, and email returns many dollars for each one spent. Use the figures as a starting line, define each metric the same way every month, and compare yourself against your own past results before you compare against anyone else.
If your numbers sit well below these ranges and you are not sure why, an audit usually finds the cause fast. You can see how Chromex audits and grows ecommerce email programs and decide whether handing the work to specialists makes sense for your store.