Email Marketing Ecommerce Conversion Rate: What Is Good?
Your email marketing ecommerce conversion rate is the percentage of email recipients who complete a purchase after getting your message. Published averages fall into two bands because sources count different things. About 0.3% to 0.5% of delivered emails turn into orders, while 2% to 5% is the usual benchmark when a "conversion" means a click through to your offer. Figures in the teens or higher usually measure orders per click, not per email.
That gap is why so many store owners compare their numbers to the wrong benchmark and either panic or celebrate for no reason. This article gives you the exact formulas, a worked example with real arithmetic, a side-by-side benchmark table, and the factors that move your target up or down. You will also see how to find the leak in your own emails and fix it.
We write this from the agency side. Chromex runs email and SMS programs for ecommerce brands. A consistent definition is what makes a number useful.
Why your ecommerce email conversion rate matters
Conversion rate is the one email metric that connects directly to revenue. Opens and clicks show interest. Conversion shows whether that interest paid for the send.
What the number tells you
A low conversion rate means the email is not turning attention into orders, whatever the cause. A rising rate means your list, your offers, and your timing are working together. Because conversion is measured against your list size, it also tells you how much revenue each subscriber is worth.
This matters most for stores that already pay for traffic. Many brands that come to Chromex get under 10% of revenue from email, while the goal is 30% to 60%. Chromex clients average about 45% of monthly revenue from email. Moving from the first number toward the second starts with measuring conversion properly.
Why opens and clicks are not enough
Open rates have been unreliable since Apple's Mail Privacy Protection began prefetching emails in 2021, which inflates opens. Clicks are sturdier, but a click is still not a sale. Reading the three numbers together tells you where the problem sits:
- High opens, low clicks: the subject line works, the email body or offer does not.
- High clicks, low orders: the problem is after the click, in the landing page, price, shipping cost, or checkout.
- Low everything: suspect deliverability or a list full of cold subscribers.
Conversion rate is the only email metric that tells you whether a send earned money.
How to calculate email conversion rate
The basic formula is orders (or other conversions) divided by the number of emails delivered, multiplied by 100. Pick one denominator and one conversion definition, then keep them fixed so your trend lines stay comparable.
Choose your conversion and your denominator
For ecommerce, count completed purchases attributed to the email, using the attribution window in your email platform. Divide by delivered emails, not sent, so bounces do not drag the rate down. Some tools divide by clicks instead, which produces a much bigger number. Neither is wrong, but you cannot compare one to the other.
Mailchimp's glossary example uses a simpler version: 500 people click through out of 10,000 recipients, so the conversion rate is 5%. That counts the click as the conversion, which suits a sign-up or pre-order page and is too generous for revenue tracking.
A worked example
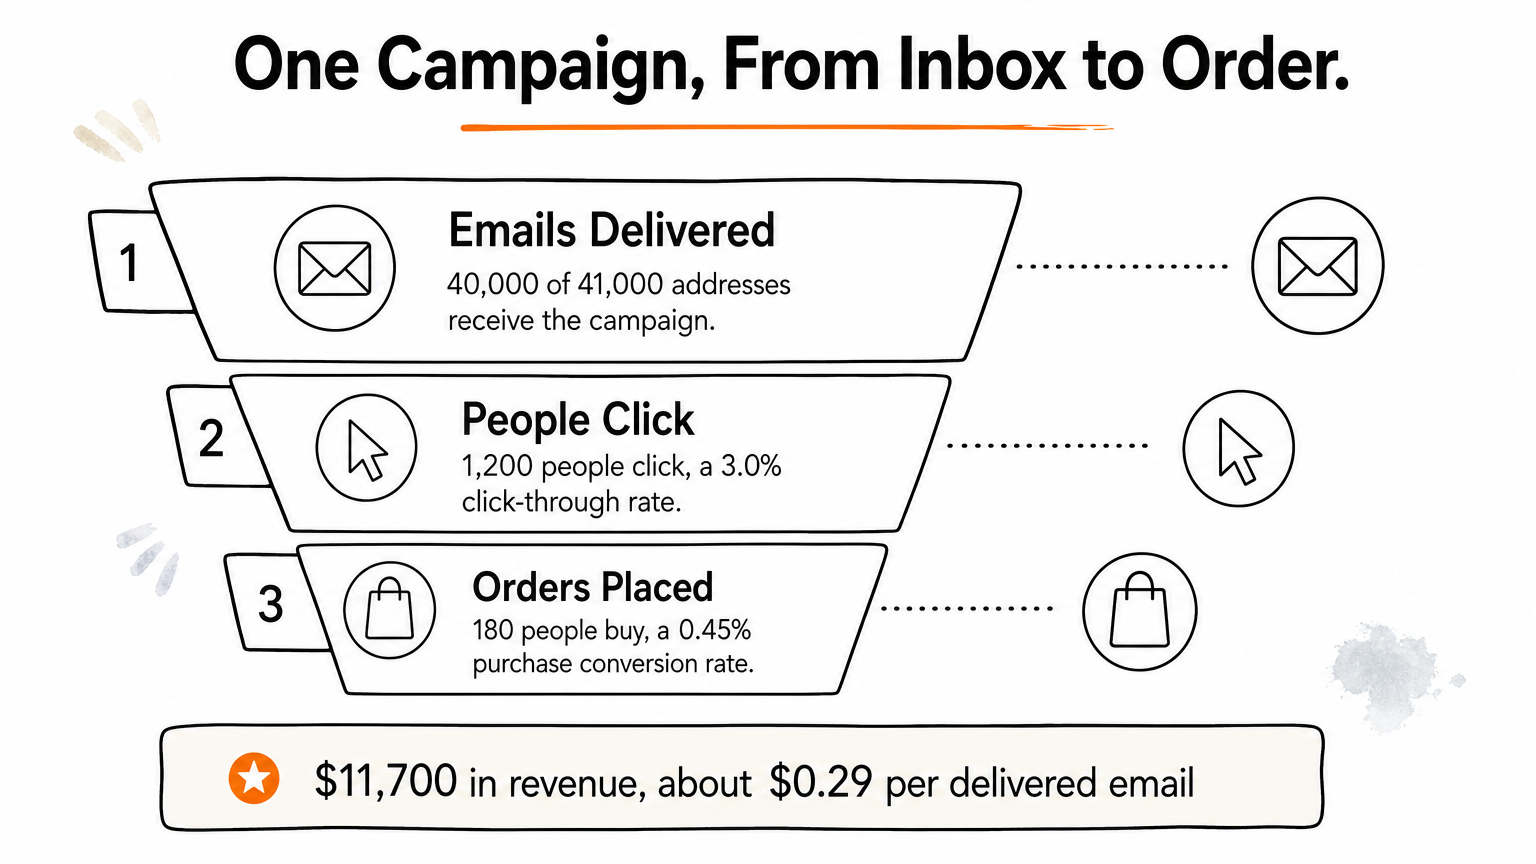
Say a store sends one campaign to 41,000 addresses. 40,000 are delivered, 1,200 people click, and 180 place an order at an average of $65.
| Metric | Calculation | Result |
|---|---|---|
| Click-through rate | 1,200 ÷ 40,000 | 3.0% |
| Purchase conversion rate | 180 ÷ 40,000 | 0.45% |
| Click-to-order rate | 180 ÷ 1,200 | 15% |
| Revenue | 180 × $65 | $11,700 |
| Revenue per delivered email | $11,700 ÷ 40,000 | about $0.29 |
This one campaign sits in all three bands from the introduction. The 3% click rate looks good, the 0.45% purchase rate is a bit above average, and the 15% click-to-order rate matches the double-digit figures some sources quote. Revenue per delivered email is the number to track alongside conversion, because it also reflects order value.
Divide orders by delivered emails and you get a rate you can trust and compare month to month.
What a good conversion rate looks like
A good email conversion rate depends on which version you measure. Use the table to match your metric to the right range before you judge your results.
Benchmarks side by side
| What you measure | Formula | Reported benchmark |
|---|---|---|
| Click-through rate | clicks ÷ delivered | 2% to 5% is considered good |
| Purchase conversion, campaigns | orders ÷ delivered | about 0.3% on average |
| Purchase conversion, automated emails | orders ÷ delivered | about 0.4% on average |
| Click-to-order rate | orders ÷ clicks | averages near 15% reported for ecommerce |
Automated emails such as welcome series and abandoned cart reminders convert better than broadcast campaigns because they reach people at a moment of intent. For comparison, site-wide ecommerce conversion rates are commonly cited around 2% to 3% of sessions, and email visitors usually beat that average because they already know your brand.
Why industry changes your target
No single industry figure is safe to copy, because the same category can report very different numbers depending on how each source defines a conversion. What reliably moves your target is the economics of your store:

- Price point: a $25 impulse item converts more readily than a $900 purchase that needs research.
- Repurchase cycle: consumables like coffee or supplements get repeat orders on a schedule, while furniture does not.
- List quality: subscribers who joined for a discount convert differently from those who joined after a purchase.
- Mix of sends: a program heavy on automated flows will average higher than one that relies on promotions.
Benchmark yourself against your own last 90 days first, and against industry figures second.
Is 2.5% a good conversion rate?
It depends on the metric. As a click-through or click-based conversion rate, 2.5% sits inside the 2% to 5% range and is solid. As a purchase rate per delivered email, 2.5% would be exceptional for a campaign and is more realistic for a small, highly targeted flow such as an abandoned cart reminder. Always ask what is in the numerator and denominator before you answer.
A "good" rate is only meaningful once you know what was counted and what it was divided by.
How to improve your conversion rate
Start with the leak your diagnostic pointed to, then test one change at a time. Spreading effort across everything at once makes it impossible to learn what worked.
Fix the biggest leak first
If clicks are fine but orders are weak, check the page the email sends people to. The product, price, and offer in the email should match the landing page exactly. If clicks are low, tighten the single call to action and cut competing links. If deliverability is the issue, no copy change will help until you fix authentication and clean inactive subscribers.

This is why Chromex begins with an audit. The first stage runs on days 1 to 5 and covers deliverability fixes, market and competitor insights, and a 60-day action plan, so effort goes where the revenue is leaking.
Build flows, then test everything
Automated sequences convert at a higher rate than campaigns, so they are the best return on effort. Most stores need the core set in place: welcome, abandoned cart, browse abandonment, post-purchase, and win-back. A sign-up form that captures buyers with intent also lifts the quality of every send that follows.
Then test continuously. Subject lines, send times, offers, and layouts each move the rate a little, and the gains compound. Chromex's Optimize stage runs mass testing from day 30 onward for exactly this reason.
Fix deliverability and the post-click experience first, then use flows and testing to compound the gains.
Know your number, then move it
Your email conversion rate is orders divided by delivered emails, and a good result is judged against the matching benchmark: about 0.3% to 0.5% for purchases per delivered email, 2% to 5% for clicks. Track revenue per delivered email beside it, diagnose from opens to clicks to orders, and improve one leak at a time.
If you would rather have specialists measure it, fix it, and keep testing, book a call with Chromex and we will audit your email program and show you where the revenue is hiding.